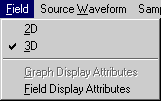
Figure 1-6: The Field Menu.
The Field menu allows you to graph and visualize field and dissipated power distributions in 2D or 3D representation. It is enabled only if an Animation Region has been created. The visualization is performed in a generated solution mode; it is "alive" and not a playback of stored frames. You can thus follow the simulation process directly, stop it, modify it, or prolong it. This is one of the most attractive and powerful features of MEFiSTo-2D .

Figure 1-6: The Field Menu.
If the Animation Region is only 1 Dl wide (i.e. if it contains only a single row of nodes, both the 2D and 3D options in the Field Menu are available.
If the output box is wider than 1 Dl, only the 3D option can be selected.
| 2D | This option allows you to visualize the output quantity along a 1 Dl wide output box in the form of a two-dimensional graph similar to the display in the Graph mode. It is suitable for displaying quantities such as the mode profile in longitudinal or transverse direction inside a waveguide, or the field profile across a discontinuity. |
| 3D | This option allows you to visualize the output quantity in an Animation Region of any size. It creates a three-dimensional field plot that is updated as the simulation progresses. |
| Graph Display Attributes | Graph Title, and name and scale of the axes can be edited in the dialog box. During a simulation, the scale of the ordinate adjusts dynamically to the signal, but you can change the graph attributes once the simulation is stopped. The display can be smooth or discretized (Bar Graph off or on). |
| Field Display Attributes | A control panel with
18 buttons and one check box appears when you select this
item. The buttons allow you to change the view parameters
during a simulation without interrupting it. The button
functions are self-explanatory and can easily be explored
by observing their effect on the screen.
Note: Hidden line removal is time-consuming and slows down the dynamic animation process. It is thus recommended not to use hidden line removal during animation unless you want to slow down the animation, and to use it only for printing or plotting 3D field pictures. |