The Johns Matrix generated in the previous Tutorial will be used in this example to terminate a post-coupled bandpass filter in a WR(28) waveguide.
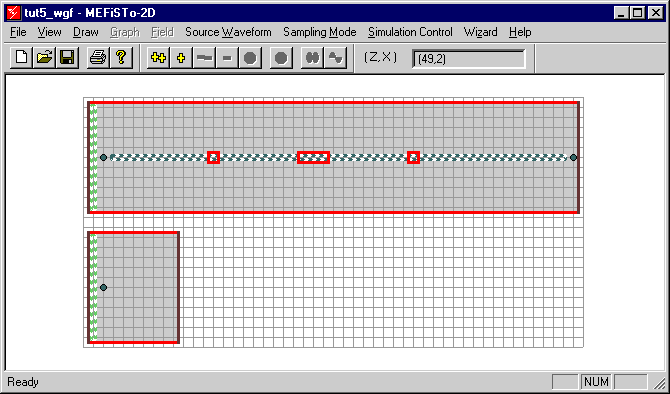
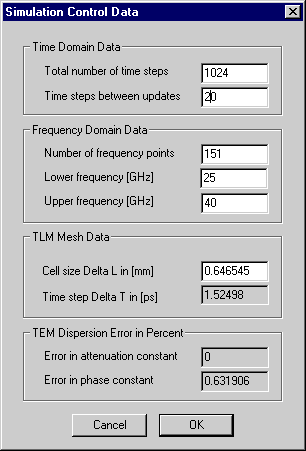
The geometry of the filter is stored in the file tut5_wgf.tlm. There is a short reference section in the lower left corner which is required for S-parameter extraction. Three probes have been placed in the reference planes. Both ends of the filter and of the reference section are terminated by Johns walls. All four Johns walls are characterized by the same Johns Matrix, tut4_j11.joh, to model wideband absorbing boundaries. The waveguide is air-filled. Hence, er = 1 and s = 0 in all computation regions. There are 11 Dl across the waveguide, therefore we have: Dl = 7.112 mm/11 = 0.646545 mm.

| Figure 2-16: | View of the post-coupled waveguide filter and reference structure. The dotted narrow box along the axis is the animation region that yields the field display in Figure 2-18. |
Other default data are shown in the Simulation Control Data Box below :

Figure 2-17: Simulation Control Data.
Start a simulation by clicking the ![]() button. Extract S-parameters
using the Graph menu.
button. Extract S-parameters
using the Graph menu.
The field distribution in the filter
can also be observed in the time domain. To this end,
activate the Draw menu and draw an Animation Region
over the filter area. Then change to the Field menu,
click on Reset, then enter the Source Waveform
menu and select Sin(f). Enter a frequency of your
choice (for example the midband frequency of the filter
determined from the previous S-parameter extraction),
set the update interval to "1", and
enter the desired number of time steps. Then click on ![]() and observe the propagation of an
electromagnetic wave through the filter. Observe, for
example, that in the passband the field amplitude in the
resonating sections of the filter becomes much higher than
the input and output signals, and that the phase
relationships in the different sections of the filter are
clearly visible.
and observe the propagation of an
electromagnetic wave through the filter. Observe, for
example, that in the passband the field amplitude in the
resonating sections of the filter becomes much higher than
the input and output signals, and that the phase
relationships in the different sections of the filter are
clearly visible.
Another way to visualize the field distribution in the filter is to display the voltage only along its axis rather than over its entire area. Proceed as follows:
- Remove the previously implemented Animation Region by drawing the same box over it, or by using the select-and-delete procedure.
- Draw a new Animation Region that is one cell wide and that includes all nodes from node (2,6) to node (48,6).
- In the Field menu, select the 2D option.
- Start the simulation by clicking
 .
. - Toggle the 2D Field Envelope Display option button in the Simulation Bar.
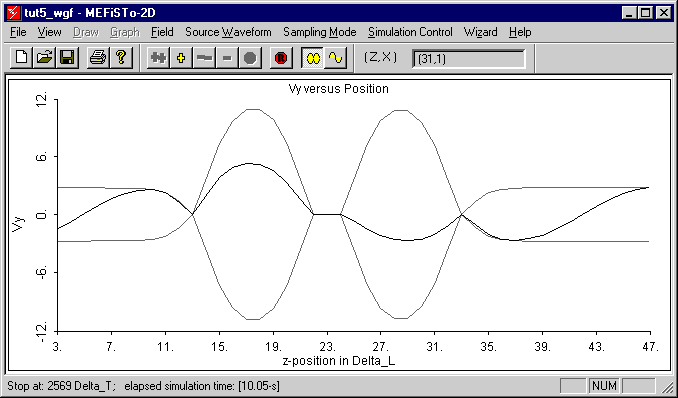
- After the steady state has been reached, click the Reset Signal Envelope button to obtain the stationary envelope of the field along the filter axis. The result is shown in Figure 2-18 for a frequency of 30.55 GHz.

| Figure 2-18: | Standing wave pattern along the axis of the filter at 30.55 GHz, obtained by placing a narrow animation region on the filter axis as shown in Figure 2-16. |