
 , both positive and
negative ones, among themselves and also with physical (non-charged)
barriers or walls.
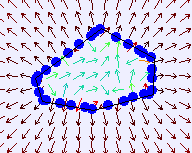
The user can build any configuration she is interested in and let the simulaton run. Of special interest is the visualization of the vector field generated by the charged particles and how it evolves dynamically.
I also included a visualization of the equipotential lines in the plane and of the potential in 3D. Just to show some of the visualization capabilities of Ejs.
The minimum and maximum of the potential are recomputed every time you switch on and off the visibility of the contour, so, when adding new particles, it is a good idea to hide the contour, add the particles, let the simulation play for a while, until a more or less stable situation has been reached, and then show the contour.
Please notice that (except when running as an applet) you can prepare and save different configuration of particles and walls. These configuration can be read later on by your students (even when running as an applet).
From time to time, freeze the particles and you will get with a final configuration in which all particles are at the walls.


Puede controlarla usando JavaScript. Por ejemplo, usando botones: